Real-Time Analytics for Twilio
Recently I have been looking into complex event processing, what the use cases for it are and the kind of insights you can get from it.
As I am a .Net developer, I thought it best to start with the Microsoft stack, so I have been experimenting with StreamInsight. There are a few examples floating around, but the one that really inspired me was the Big Data Twitter Demo (link).
After seeing the Twitter demo I jumped into gear and built a real-time dashboard for Twilio.
For those who are not familiar with Twilio, they are a cloud based telephony company that sells telephone numbers which are powered by REST APIs. This allows developers to build complex and dynamic telephony applications (more details).
So what did I build, and why did I bother?
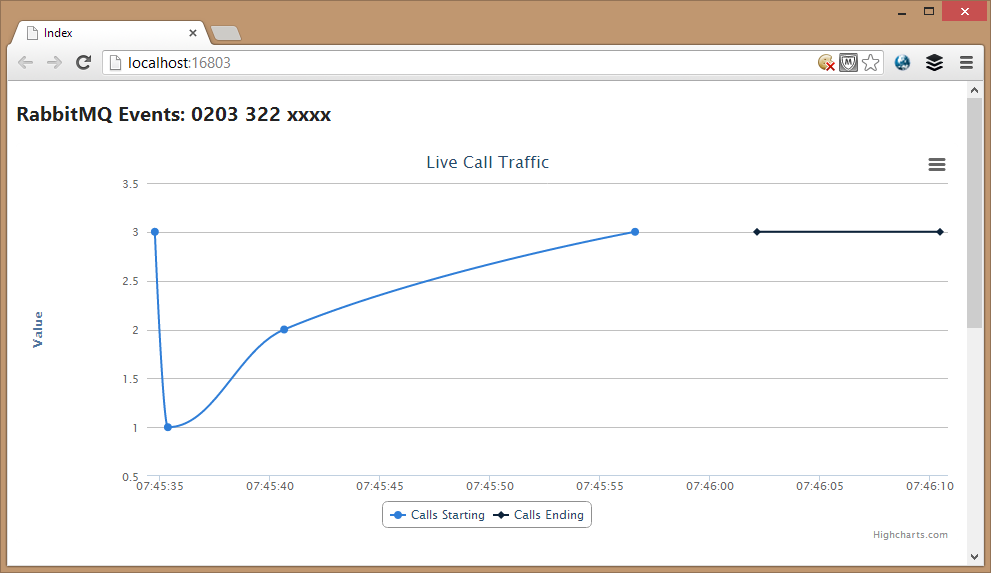
You can see from the screenshot below that it is a very simple real-time dashboard.
The graph shows:
- In blue - total number of calls that started in a 5 second window
- In black - total number of calls that ended in a 5 second window
All of this data is produced by making a telephone call to my Twilio phone number.
(If you add up the numbers then you will see that the start and end aren’t equal, this is because at the time of the screen shot a number of calls were still in progress).
The system is not complicated, but there are a number of different parts to it:
- ASP.Net WebAPI - This is the endpoint that Twilio fires requests to when it received a phone call to my telephone number
- RabbitMQ - When a request is made from Twilio to the WebAPI, the WebAPI will send a “start” or “end” message to RabbitMQ
- StreamInsight application - This is the glue between the events received and the output sent to the client. It listens to the RabbitMQ queue and then with the events received does the fancy “complex event processing”
- ASP.Net MVC Website - Which uses SignalR (a realtime framework for communication between a web client and server) to update the graph as events are processed
Looking at this stack you’re probably thinking,
“that is way too complicated to get a simple graph on a webpage!”
And you’d be right if all I wanted was a simple graph, I could just have my WebAPI broadcast messages directly to SignalR and cut out everything in between.
What StreamInsight Adds
If all I wanted was a graph showing the number of calls starting in a given window, I could probably build up the logic to do that with a bit of effort myself. However, what StreamInsight is designed for is complex event processing.
So to collect the number of events in a 5 second window all I have to do is write this query:
|
|
To get it working end to end requires a few more components, but what I’m trying to show here is how simple it is to write queries. In later posts I’m going to explain how to write a StreamInsight application.
The example above is very trivial, so imagine that rather then just a single Twilio number you are building a system for a large telecoms company that has hundreds or thousands of phone numbers, geographically dispersed, and each number is tied to a different department and you wanted to see which departments were receiving the largest volume of calls.
Or, take another more complicated example, you want to correlate diagnostic events, against the number of failed calls since an outage.
It would be very difficult (neigh on impossible) to write this kind of logic inside a Web API controller method.
With StreamInsight it is very easy, you can do all kinds of aggregations on events. You can also join multiple event streams together. This is where the power of StreamInsight and complex event processing is.
Now I hope you’re beginning to see the necessity of all the pieces of the stack I mentioned above.
The advantage of using RabbitMQ as the input into StreamInsight means you could have events from other systems (e.g. diagnostics) all going into one system and it can all be processed by StreamInsight to find patterns and alert in real time to engineers.

🍪 I use Disqus for comments
Because Disqus requires cookies this site doesn't automatically load comments.
I don't mind about cookies - Show me the comments from now on (and set a cookie to remember my preference)