Debugging Custom SSIS Components
In the past I have written extensively about how to build custom components for SQL Server Integration Services, these posts have always been focused on the ‘happy path’, if you’re not familiar with this phrase it refers to the path through your application that works exactly as expected. Often times in development we have to deal with the sad path, or when things aren’t working as we would like or expect.
In this post I will show two techniques that can be used to help with debugging custom SSIS components.
Attaching the Visual Studio Debugger
You will need to have Visual Studio open with the source code for the custom component and have SSDT open with the package that uses the custom component.
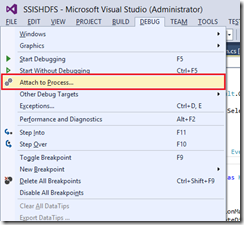
From Visual Studio select the Debug menu then Attach to Process
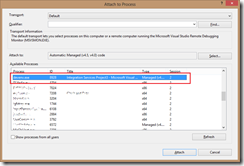
This will bring up the following window showing a list of available processes for debugging:
In the list of available processes select the instance of devenv.exe that corresponds to your SSIS solution, then click Attach. Once attached any breakpoints that you define will be hit, from where you can debug your component.
This method works just fine for when you want to debug the setup and configuration of your package, that is, anything the users of your component will be doing prior to executing the package.
The disadvantage of this method is that once you actually start executing the package the debugger will detach itself. The reason for this is because execution of the package happens within a different process. Continue reading for a better method.
Launching the Debugger from in Code
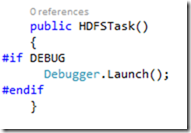
Another way to automatically start debugging is to add the following line of code:
|
|
Into the particular method that you want to debug or into the constructor.
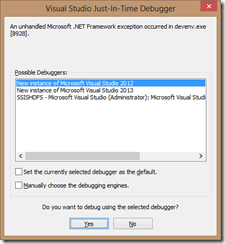
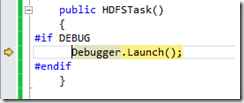
Here you can see I’ve added the Debugger.Launch() code into the constructor for my HDFS Task Component, Now when I open a package in SSDT that uses this component, or if I drag a new instance of the task into an existing package the following window will appear:
Here I can select how I want to debug the application. During development of custom components I always have an instance of visual studio open with my component solution and you can see it listed as the third option in the image above. By selecting this option and clicking Yes I will be taken back to that instance of Visual Studio which will then attach itself to my instance of SSDT. It will then break execution.
At this point I can set any breakpoints where I want to break future execution. From here press F5 to continue. Visual Studio will remain attached to SSDT and any breakpoints you’ve defined will interrupt execution and bring you back here.
The disadvantage of this method is that the “Do you want to debug this application” window will keep appearing at various points during package design unless you attach the debugger.
The advantage of using this method is that once you actually start executing your package you will again be prompted to attach the debugger, which means you will be able to debug the component during package execution.
Make sure you either remove this line of code before shipping it for actual use or wrap it around the #if DEBUG / #endif compiler directives as shown above and remember to use the Release configuration for production use!
🍪 I use Disqus for comments
Because Disqus requires cookies this site doesn't automatically load comments.
I don't mind about cookies - Show me the comments from now on (and set a cookie to remember my preference)