Azure Stream Analytics
There have been a number of new Azure services announced in recent weeks, one that caught my eye was Azure Stream Analytics. Stream Analytics is a cloud based event processing engine, which ingests real time events from various sources, runs a temporal query and then outputs the results for you to consume or to store for later analysis.
The feature set currently available is a simplified version of StreamInsight, the on-premise predecessor. I’ve written previously about using StreamInsight to visualize telephone calls in real-time. So I thought I would redo this using Stream Analytics.
The pieces of the puzzle
There are a number of different components to the overall solution
What they do:
- Fake Telephony App Server - this publishes events to the Azure Event Hub (CallStatsIn)
- Event Consumer - this subscribes to the events which are published by Stream Analytics and broadcasts the events to a SignalR hub
- Web Dashboard - hosts the SignalR hub and a web page which listens to the SignalR hub and updates a real-time chart as data comes in
Events and Queries
The events which the Fake Telephony App Server produces aren’t very complicated:
|
|
On a random schedule it will generate a number of CallStarted, CallEnded, CallDropped, CallNotAnsweredBusy events and publishes them to the Event Hub (CallStatsIn)
In Stream Analytics I have a job which is subscribed to the CallStatsIn Event Hub and aggregates this data with the following temporal query:
|
|
Web Dashboard
The above query will stream the results to the CallStatsOut Event Hub which my consumer is subscribed to. The consumer will then broadcast results as they are received to a SignalR Hub. My web dashboard is subscribed to the SignalR hub and will update my line chart in real-time.
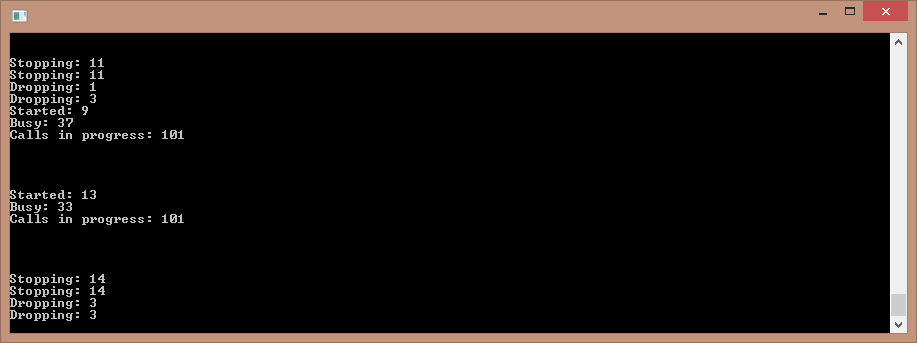
This is the output from the Fake Telephony Server App, showing the total number of events being published to the CallStatsIn Event Hub.
This is the raw data from the CallStatsOut Event Hub, which is then broadcast to the SignalR hub which the dashboard is subscribed to
Wrapping Up
My first impressions from working with Stream Analytic are overall very positive. It is an easy service to get going with and has lots of potential.
So far the only downside that I’ve come across is that you’re only allowed one output per job. This means if you wanted to store the results for later processing you would need to setup two duplicate jobs with the same query but with different outputs (PITA to maintain).
I’ll put my code up on GitHub in the coming days for anyone who is interested.


🍪 I use Disqus for comments
Because Disqus requires cookies this site doesn't automatically load comments.
I don't mind about cookies - Show me the comments from now on (and set a cookie to remember my preference)