Improving .Net Performance
Over the past couple of weeks we’ve noticed that our Reporting service is terribly slow.
The above chart is part of our APM (Application Performance Monitoring) solution built on top of MiniProfiler and Splunk (see this blog post for more details). Our reporting service works by processing messages which are queued up by various other services onto a queue in RabbitMQ. What this chart is showing is that the reporting service is working at a very constant and slow pace. It will eventually get through the backlog of messages, but it takes it a few hours each morning while the CPU sits at around 100%.
Instead of the chart above, what I’d rather see is a big spike in activity that is sustained for a (much) shorter period of time!
In this post I’m going to show how I used the built-in tooling in Visual Studio 2013 to find and diagnose the bottlenecks in our code and then visualize the improvement in performance using Splunk and MiniProfiler.
Finding and fixing performance bottlenecks
I’ve known for a long time that Visual studio has built-in performance sampling tools, but have rarely used them. I found Sasha Goldshtein’s (blog|Twitter) Pluralsight course on Measuring .Net Performance an excellent overview of how to get started with them.
To measure the performance I first queued up a significant number of messages for the reporting service to process then started the Visual Studio Profiler.
Profiling CPU Usage
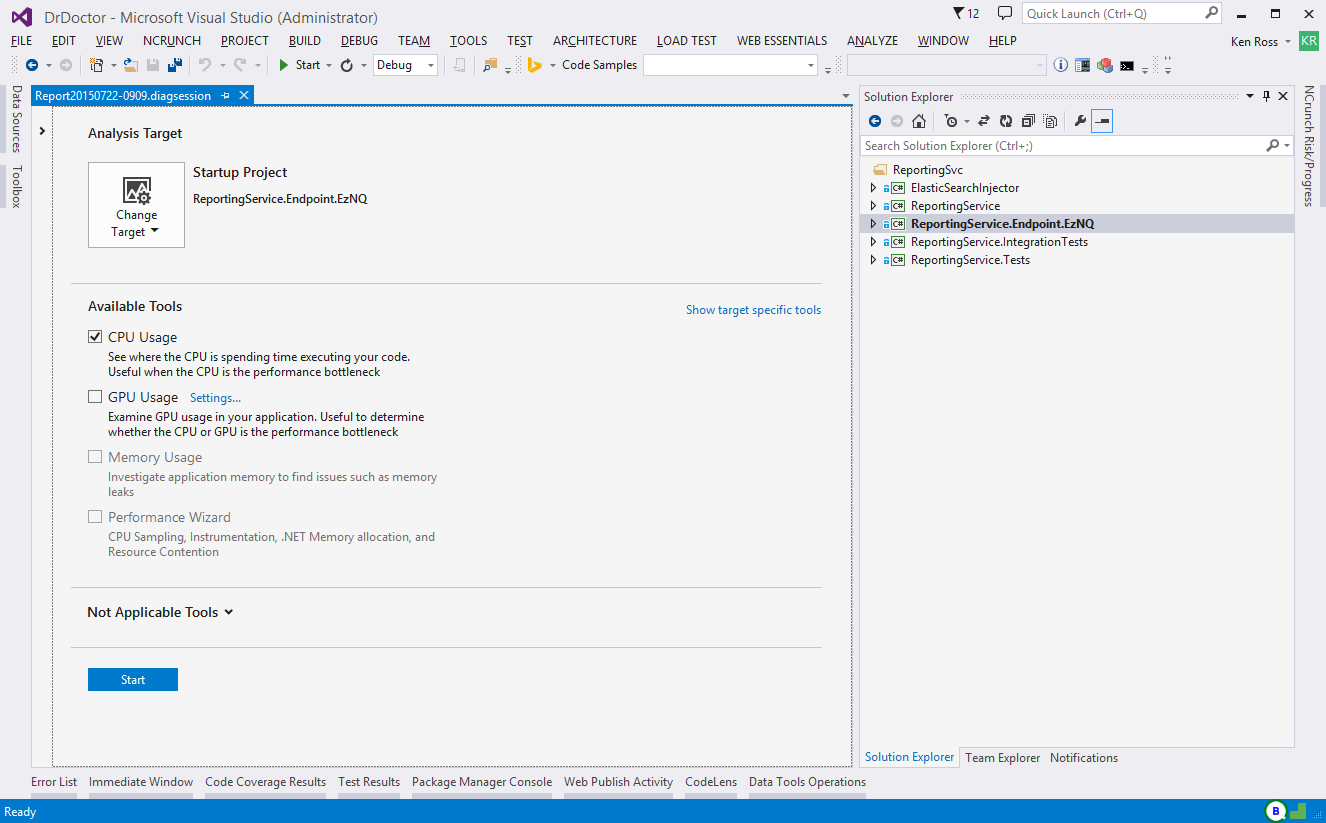
I started by setting the project I wanted to profile as the “Startup project”. Then from the Analyze menu, selected Performance and Diagnostics, which brings up the following window
I then selected Performance Wizard under Available Tools and then clicked the Start button. This brings up a dialog where you can select a few options, I selected CPU sampling as the profiling method, then the Reporting Service project as the profiling target, then clicked finished. The Reporting service then started and Visual Studio started profiling, after about 5 minutes I stopped the profiling.
Viewing Profiler Reports and fixing bottlenecks
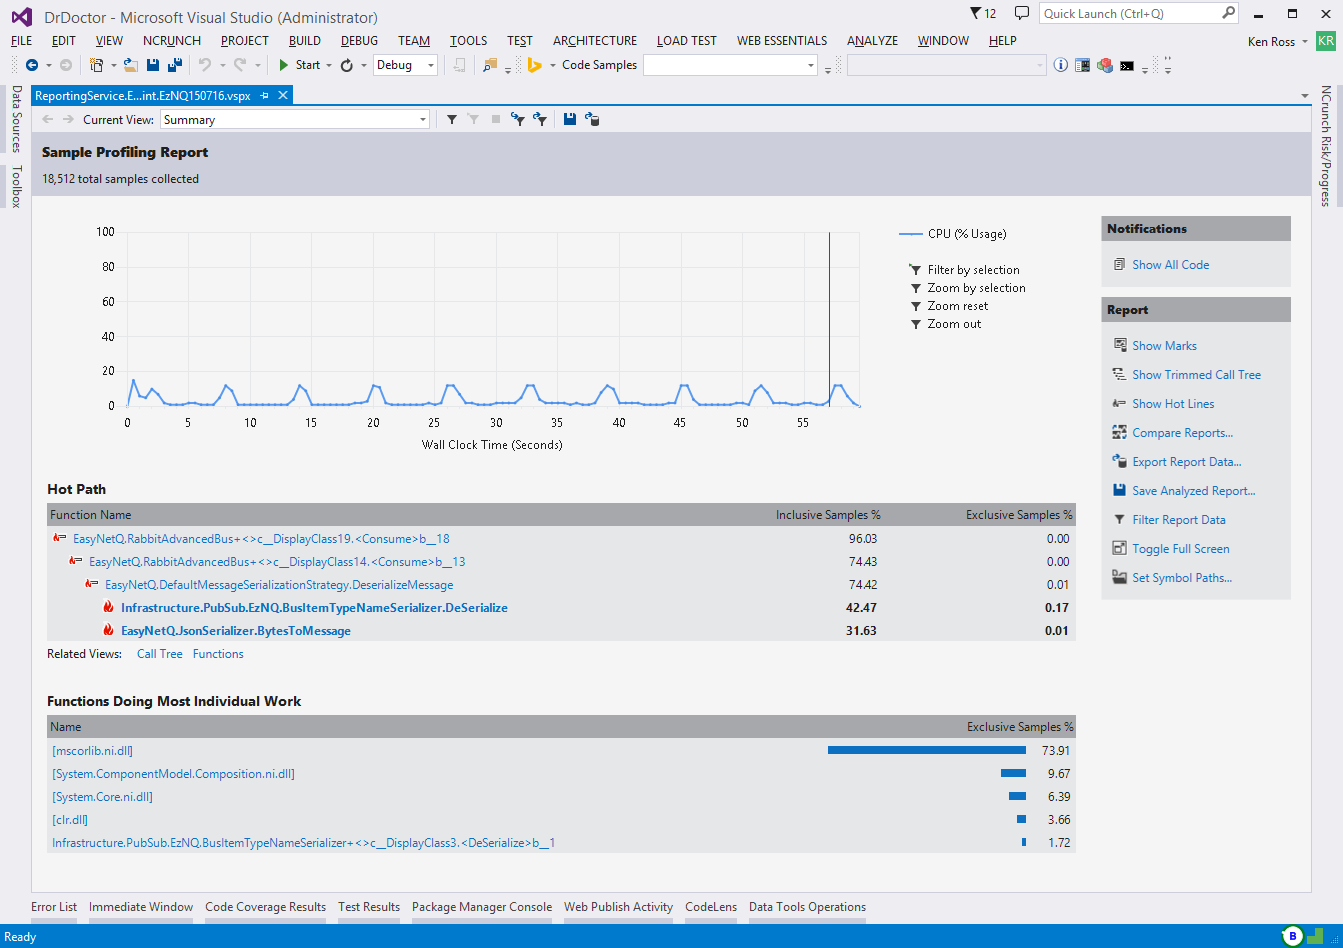
This is what the first profiling report looked like
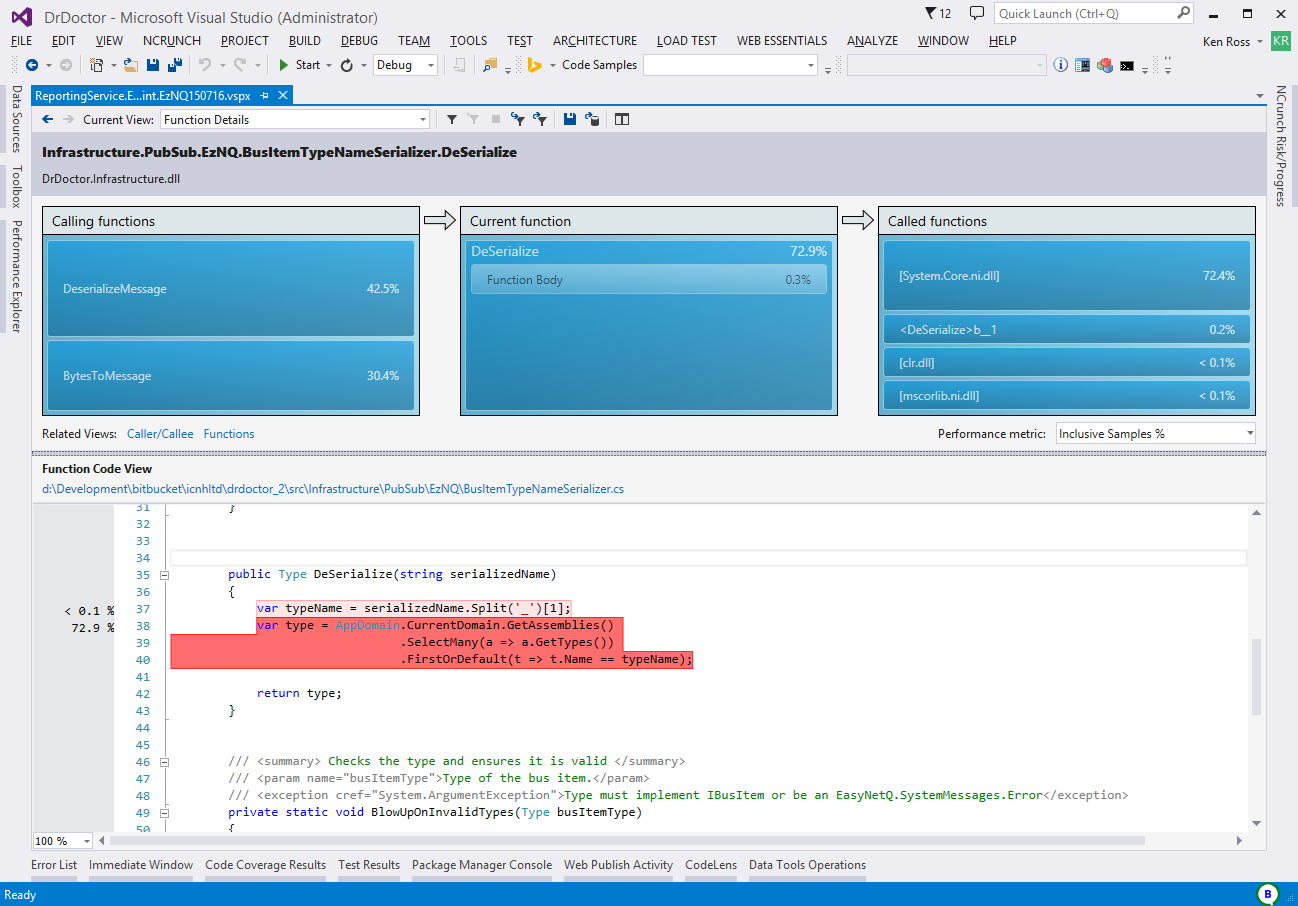
As you can see from the Hot Path, the Infrastructure.PubSub.EzNQ.BusItemTypeNameSerializer.DeSerialize method gets called lot and is potentially very slow! The good news here is that this is our code, which means I can click on this row and visual studio will take me to this method, and even highlight the expensive code.
The class in question is an implementation of an interface which is part of EasyNetQ (a very nice .Net API for RabbitMQ which all of our services use). The interface ITypeNameSerializer let’s us customize our queue names and tells EasyNetQ what type it should deserialize a message into.
As shown above there is a clear bottleneck in this code, the fix turned out to be pretty straightforward, I created the typesCache Dictionary at the class level, and then updated the DeSerialize method to:
|
|
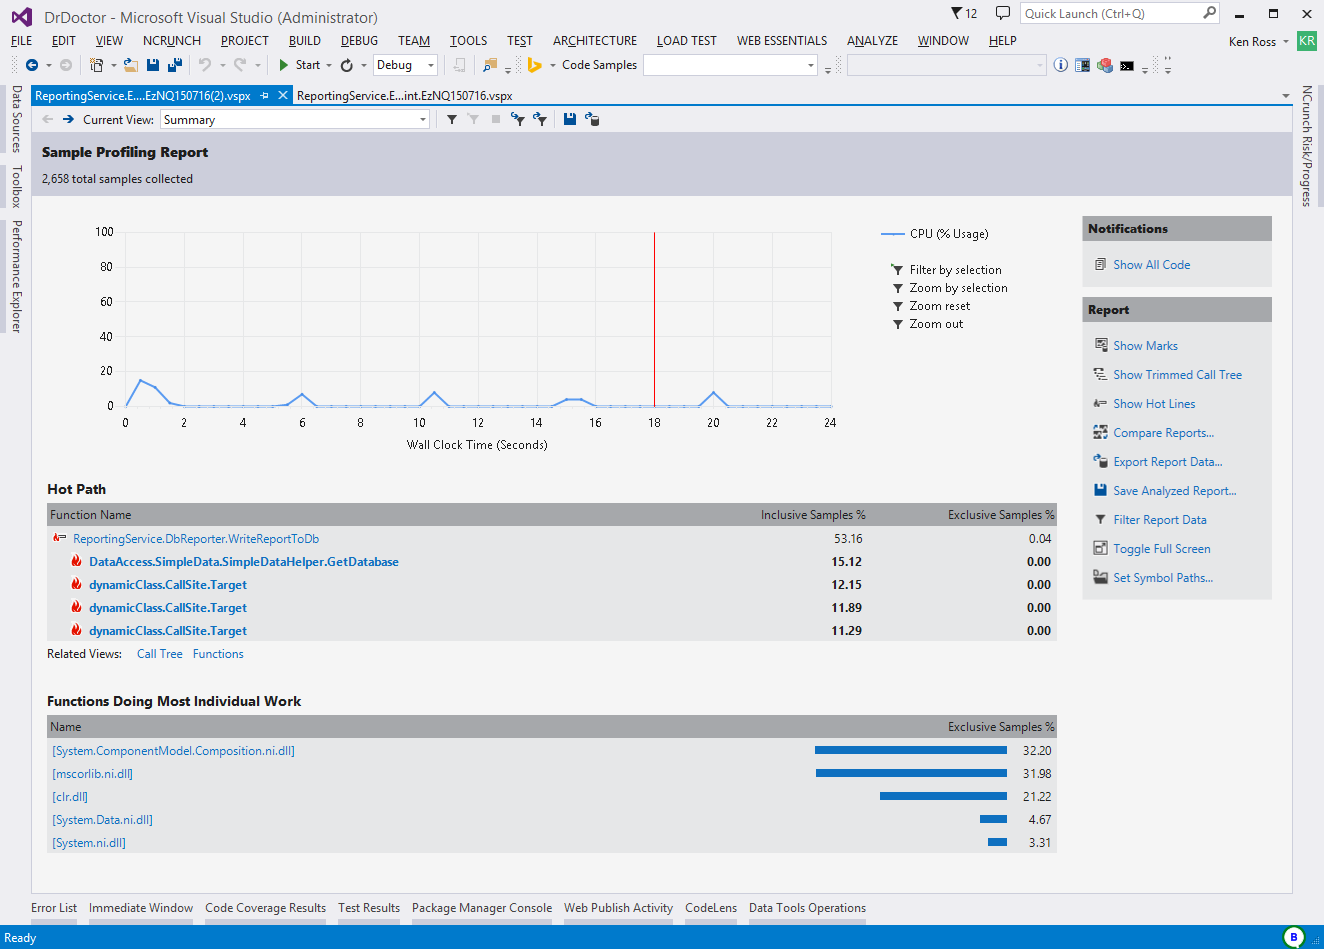
After making these changes I ran the profiler again to see what difference that had made, here are the profile results for the second run through
As you can see the Infrastructure.PubSub.EzNQ.BusItemTypeNameSerializer.DeSerialize method doesn’t get a mention, looks like the fix was successful. But now a call to DataAccess.SimpleDataHelper.GetDatabase in the DbReporter class is in the hot path.
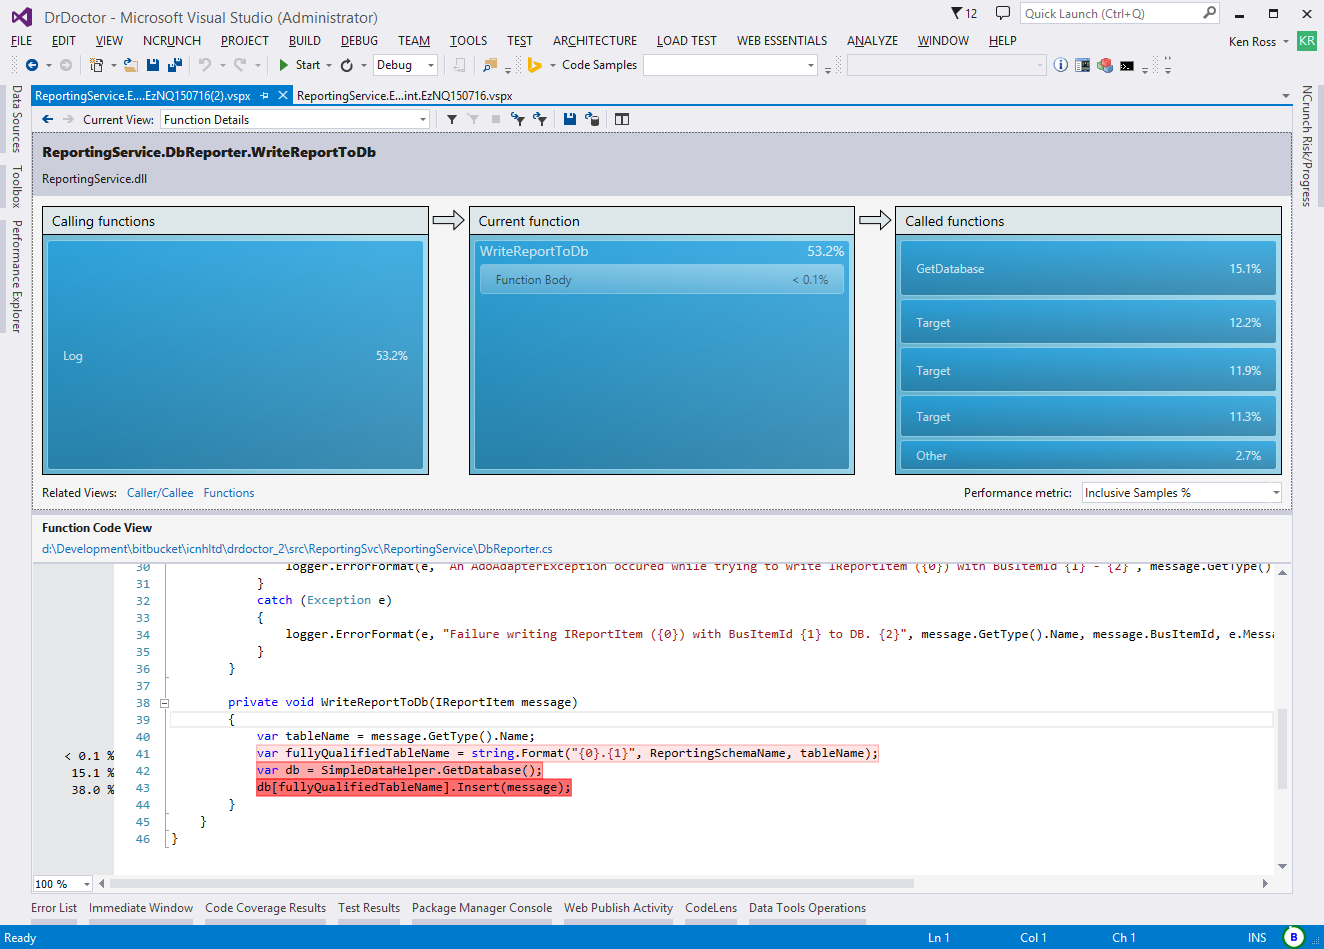
Clicking onto the ReportingService.DbReporter.WriteReportToDb row brings up the code for that method
This c# code probably has any DBA wriggling in their seat right about now (sorry!), this method is writing each message that it processes into a corresponding table in our database using the likes of c# dynamic and SimpleData. It’s pretty powerful and very neat as we don’t have to write lots of code to persist all the different reporting events to the database.
Sadly there isn’t much that can really be done about the .Insert call, however after reading through the SimpleData documentation I realized that I don’t need to continually make calls to .GetDatabase, but rather can do this once in the constructor and SimpleData will take care of opening and closing the connections as needed.
After making these two fixes the profiler results after a third run don’t indicate anything specific that can be “fixed”, so it was time to push it up to our testing environment and do some real testing.
Comparing Performance
As I mentioned above our custom APM solution is built on top of Splunk and MiniProfiler. There are a number of advantages that we get from this that we wouldn’t get from the likes of New Relic or Stackify. One advantage is that we can add our own meta data to all the performance data we generate.
We put a Version number into all the performance data that we generate, this comes from the NuGet version number generated by TeamCity as part of our build process. Because we put this Version number in it means comparing performance between versions becomes trivial.
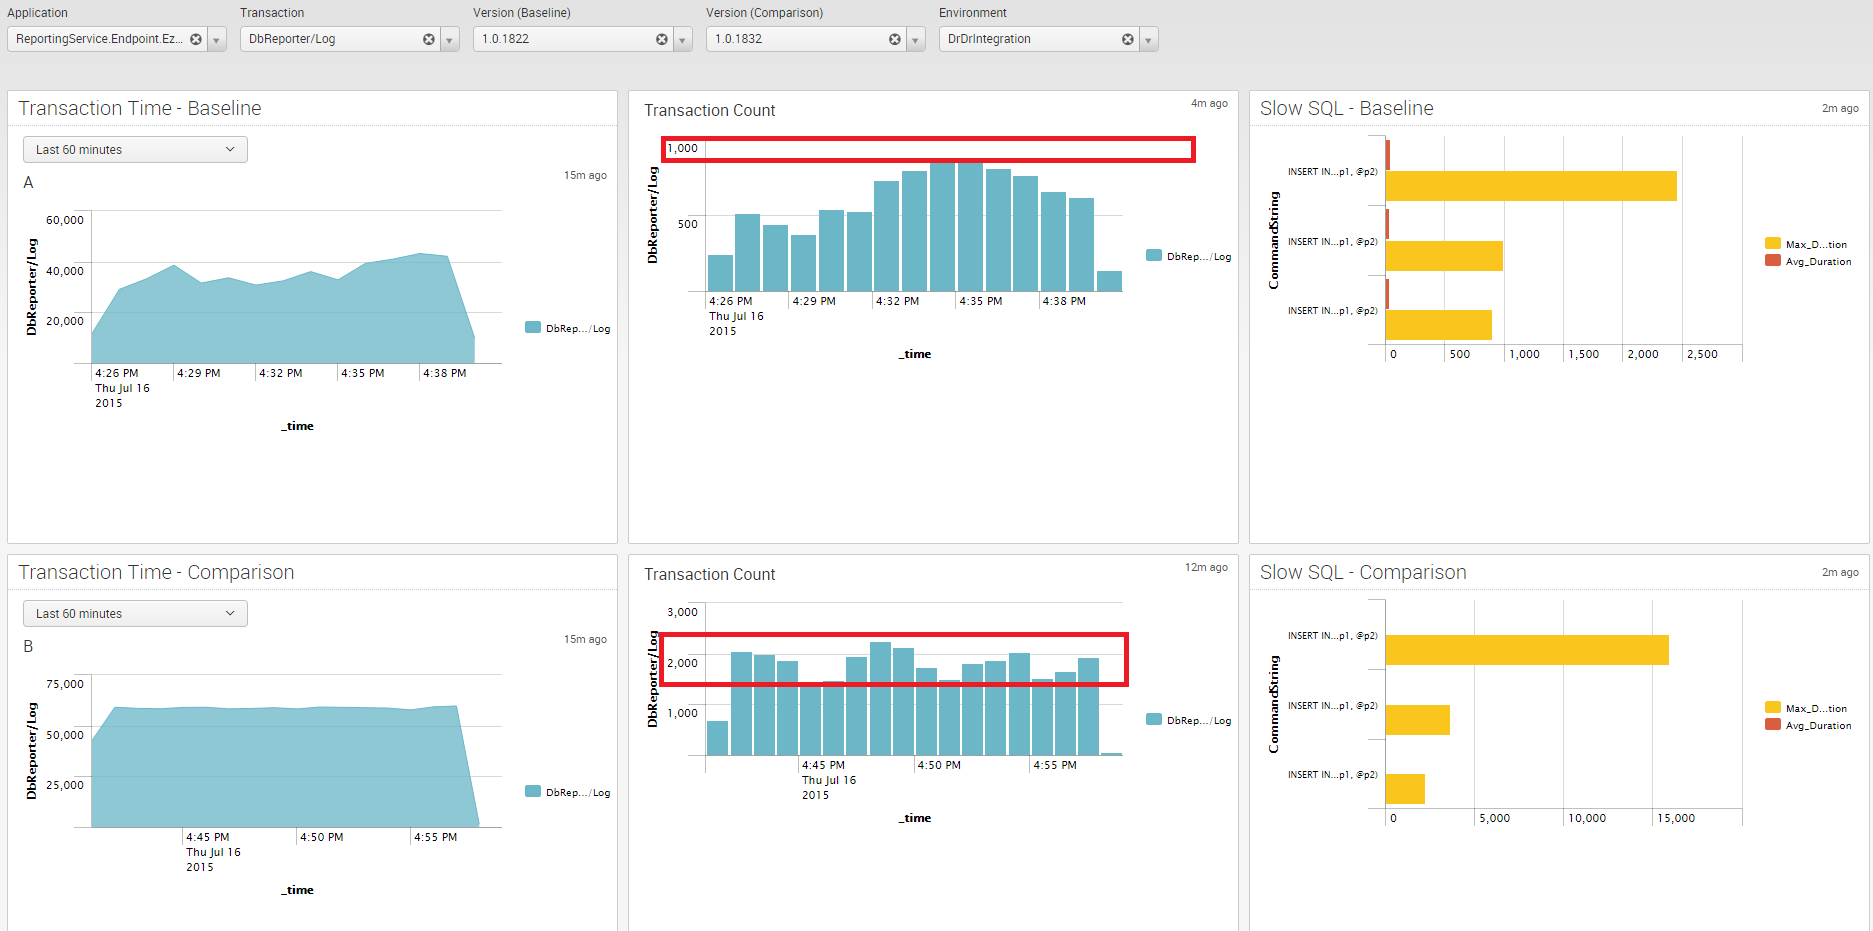
In Splunk I created the following dashboard, which allows me or any of my fellow developers at DrDoctor to select an Application and Transaction and then a baseline and comparison version.
Judging by the results shown above, it’s working at roughly twice the speed, I’d have hoped for it to be a bit faster than that, but still I’m not complaining!
Unexpected consequences
Our Reporting service does two things it writes all IReportItem messages which it processes to their respective table in the database and the second thing is write all events into a log file for Splunk to index.
While doing some local testing I noticed that even writing to a log file was slow! The maximum speed I saw was ~50messages/second just to write to a log file! After making the fixes above the processing speed went up to 5,000 messages/second! Not insignificant that’s for sure.


🍪 I use Disqus for comments
Because Disqus requires cookies this site doesn't automatically load comments.
I don't mind about cookies - Show me the comments from now on (and set a cookie to remember my preference)